
October Math Tools for Teachers: Make Lesson Planning a Treat!
October is here and while the spooky vibes are in full swing, we want to make sure your Math class
So, the Common Core Algebra I exam was given this morning and the conversion curve was released as well. We had received advanced warning, about a week ago, that the state had done some “Scale Maintenance” on the Common Core Algebra I conversion scale. The memo was, as usual, filled with technical jargon out of NYSED, but one line caught everyone’s attention (all five of us that read it). The line went something like this:
With the curve maintenance, we expect more students to pass the Common Core Algebra I exam and more students to achieve higher grades.
Now, why would the curve need maintenance? Well, when the Common Core Algebra I exam was first given in June of 2014 a curious thing occurred. NYSED decided that they would make the percent needed to pass the test (scaled to a 65) pretty much the same as it had been on the Integrated Algebra exam. This raw percent was right around 35% of the test points earned. So, they made the test still relatively “easy” to pass.
But, the seismic change that happened to the conversion curve was the score a student needed to earn an 80. As any teacher or parent can tell you, the difference between a 79 and an 80 isn’t a point. It is a chasm. An 80 feels good. An 80 feels like you accomplished something. A 79 just seems not quite good enough. And a 72? Well, it’s better than failing, but, especially for an 8th grader taking the exam, it will likely feel like failing it.
So, what did it take to get an 80 on the old Integrated Algebra exam? Right around a 60%. So, a student who knew 60% of the credit on the older Algebra exam felt like they got a good grade. What did a student need on the June 2014 Common Core Algebra I exam, to get an 80? Well, they basically needed an 80. It was actually a 78%, but that’s splitting hairs. Here’s a graph that shows all of this:
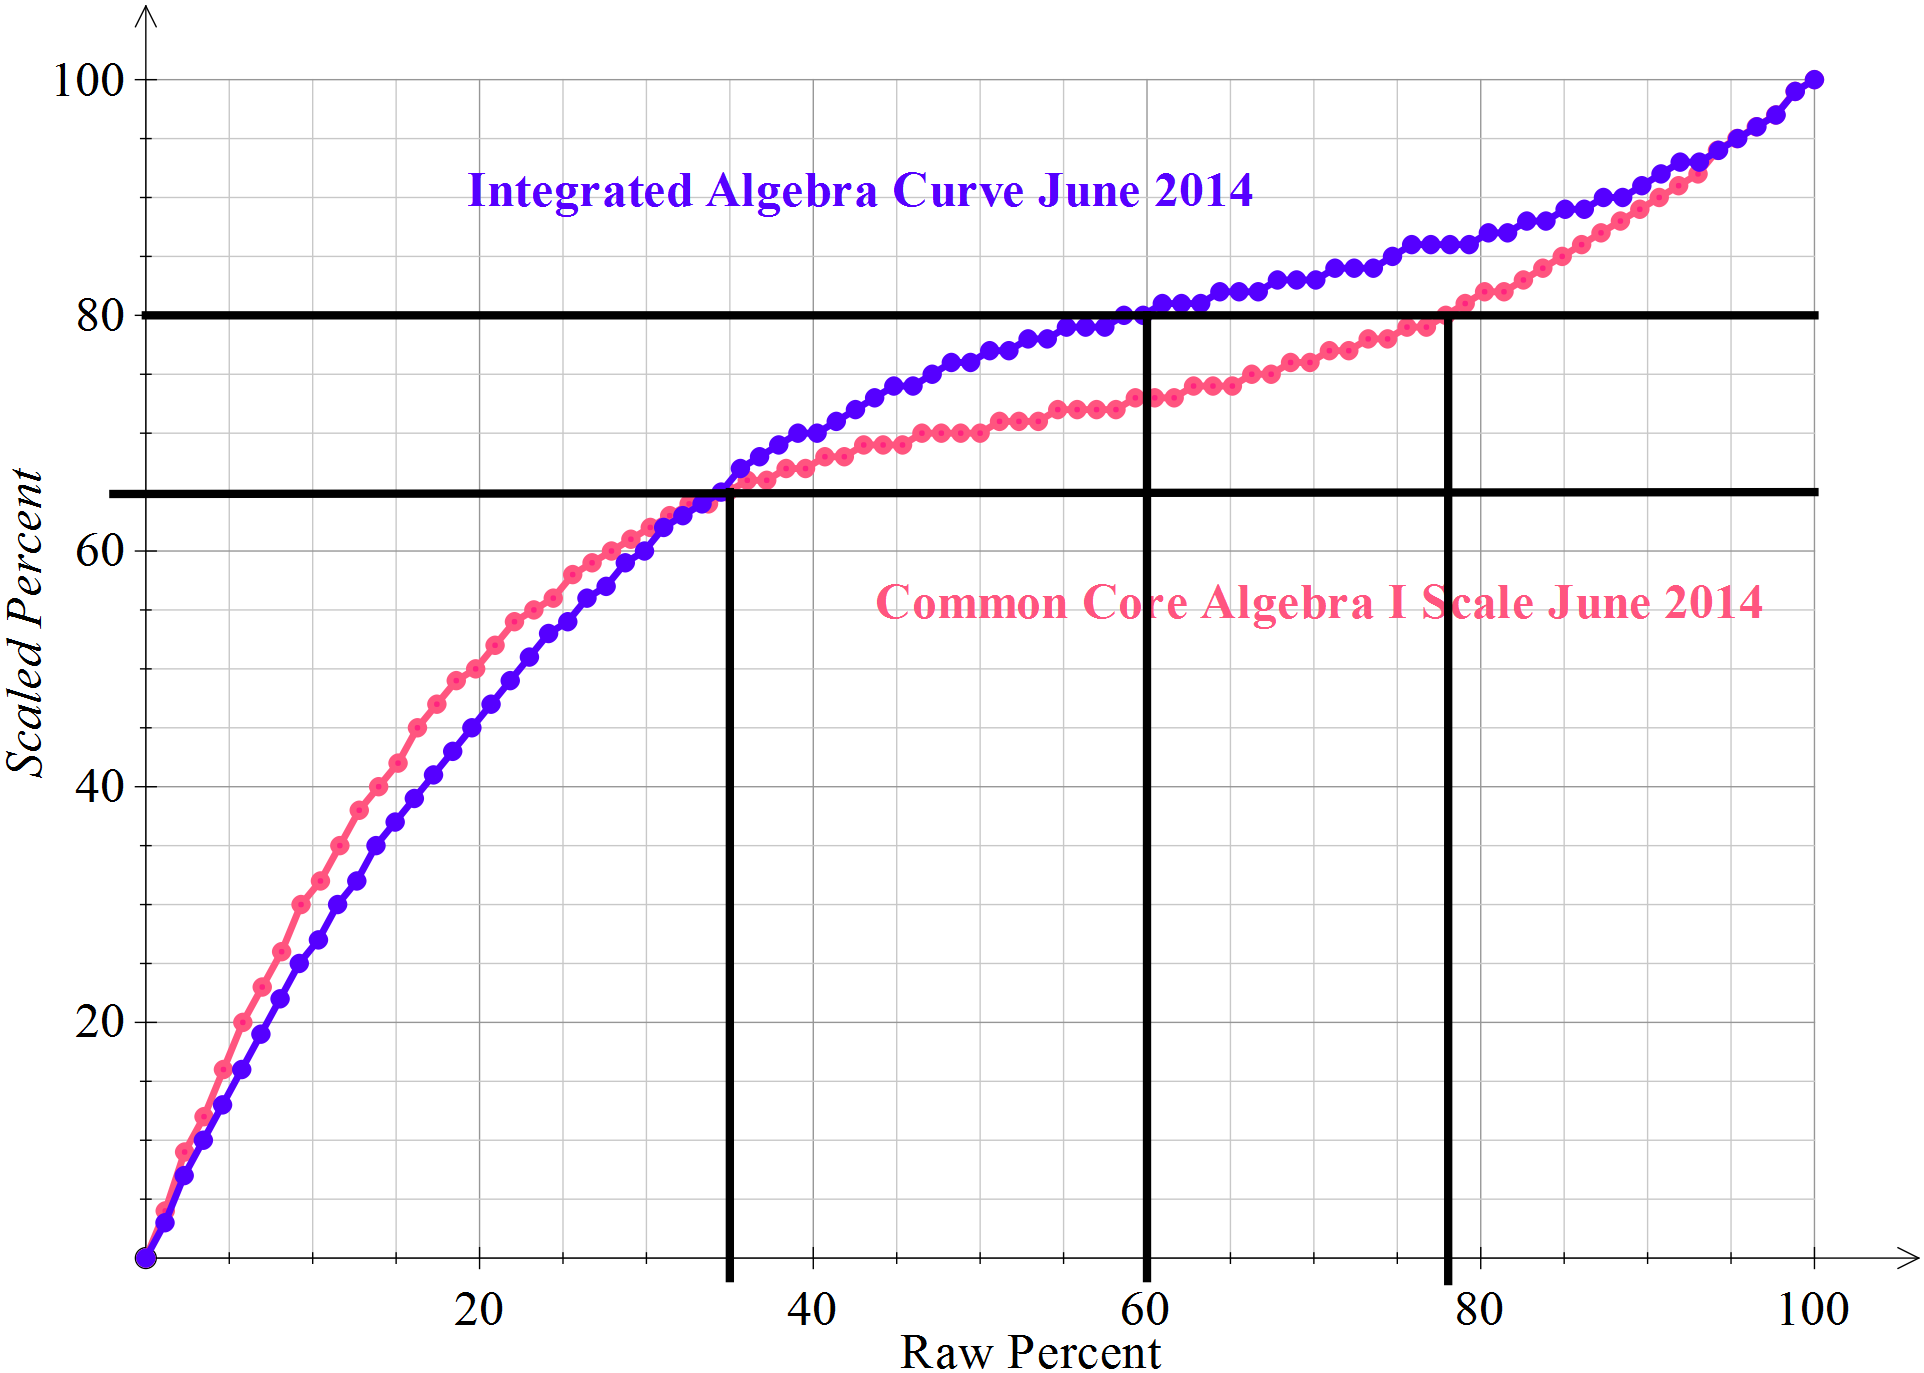
Now, the Common Core conversion curve has real mathematical problems (which leads to political problems as well). Think about this for second:
35% raw = 65% scaled
80% raw = 80% scaled
Why is this a problem? Well, try to cram 45% of the raw score scale (35% to 80%) into only 15% of the scaled score scale. That leads to all sorts of problems. For instance, a kid who scored a 47 out of 86 points earned a scaled score of 72. But a kid who scored a 58 out of 86 earned a scaled score of a 75. That second student scored 11 points more (its actually 13% points more) than the first student, but only went up 3 percent points. What????
But, the real issue that many, many schools faced were kids who did quite well during the school year, many of them advanced 8th graders, and then scored a 78, a 75, or maybe even as low as a 72 on the Common Core Algebra I exam. But, how bad is that 72? Well, a 72% on the June 2014 CC Alg I exam corresponded to a raw percent of 58%. What would 58% raw earn you on the Integrated Algebra exam? Oh, right around an 80% scaled.
So, a little “scale maintenance” was certainly in order. And, boy did they do some!!! Let’s start with the most important number, the raw percent needed to pass. For comparison:
June 2014 Integrated Algebra exam: 35% raw score needed to pass
June 2014 Common Core Algebra I exam: 35% raw score needed to pass
June 2016 Common Core Algebra I exam: 31% raw score needed to pass
So, they lowered the percent needed to pass. To give you some perspective, it basically means a student could miss two additional multiple choice questions and still pass. But, now the question of the 80. Again, the comparison:
June 2014 Integrated Algebra exam: 59% needed to scale to an 80%
June 2014 Common Core Algebra I exam: 78% needed to scale to an 80%
June 2016 Common Core Algebra I exam: 59% needed to scale to an 80% (sound familiar?)
Here’s a graph to show all three conversion curves:
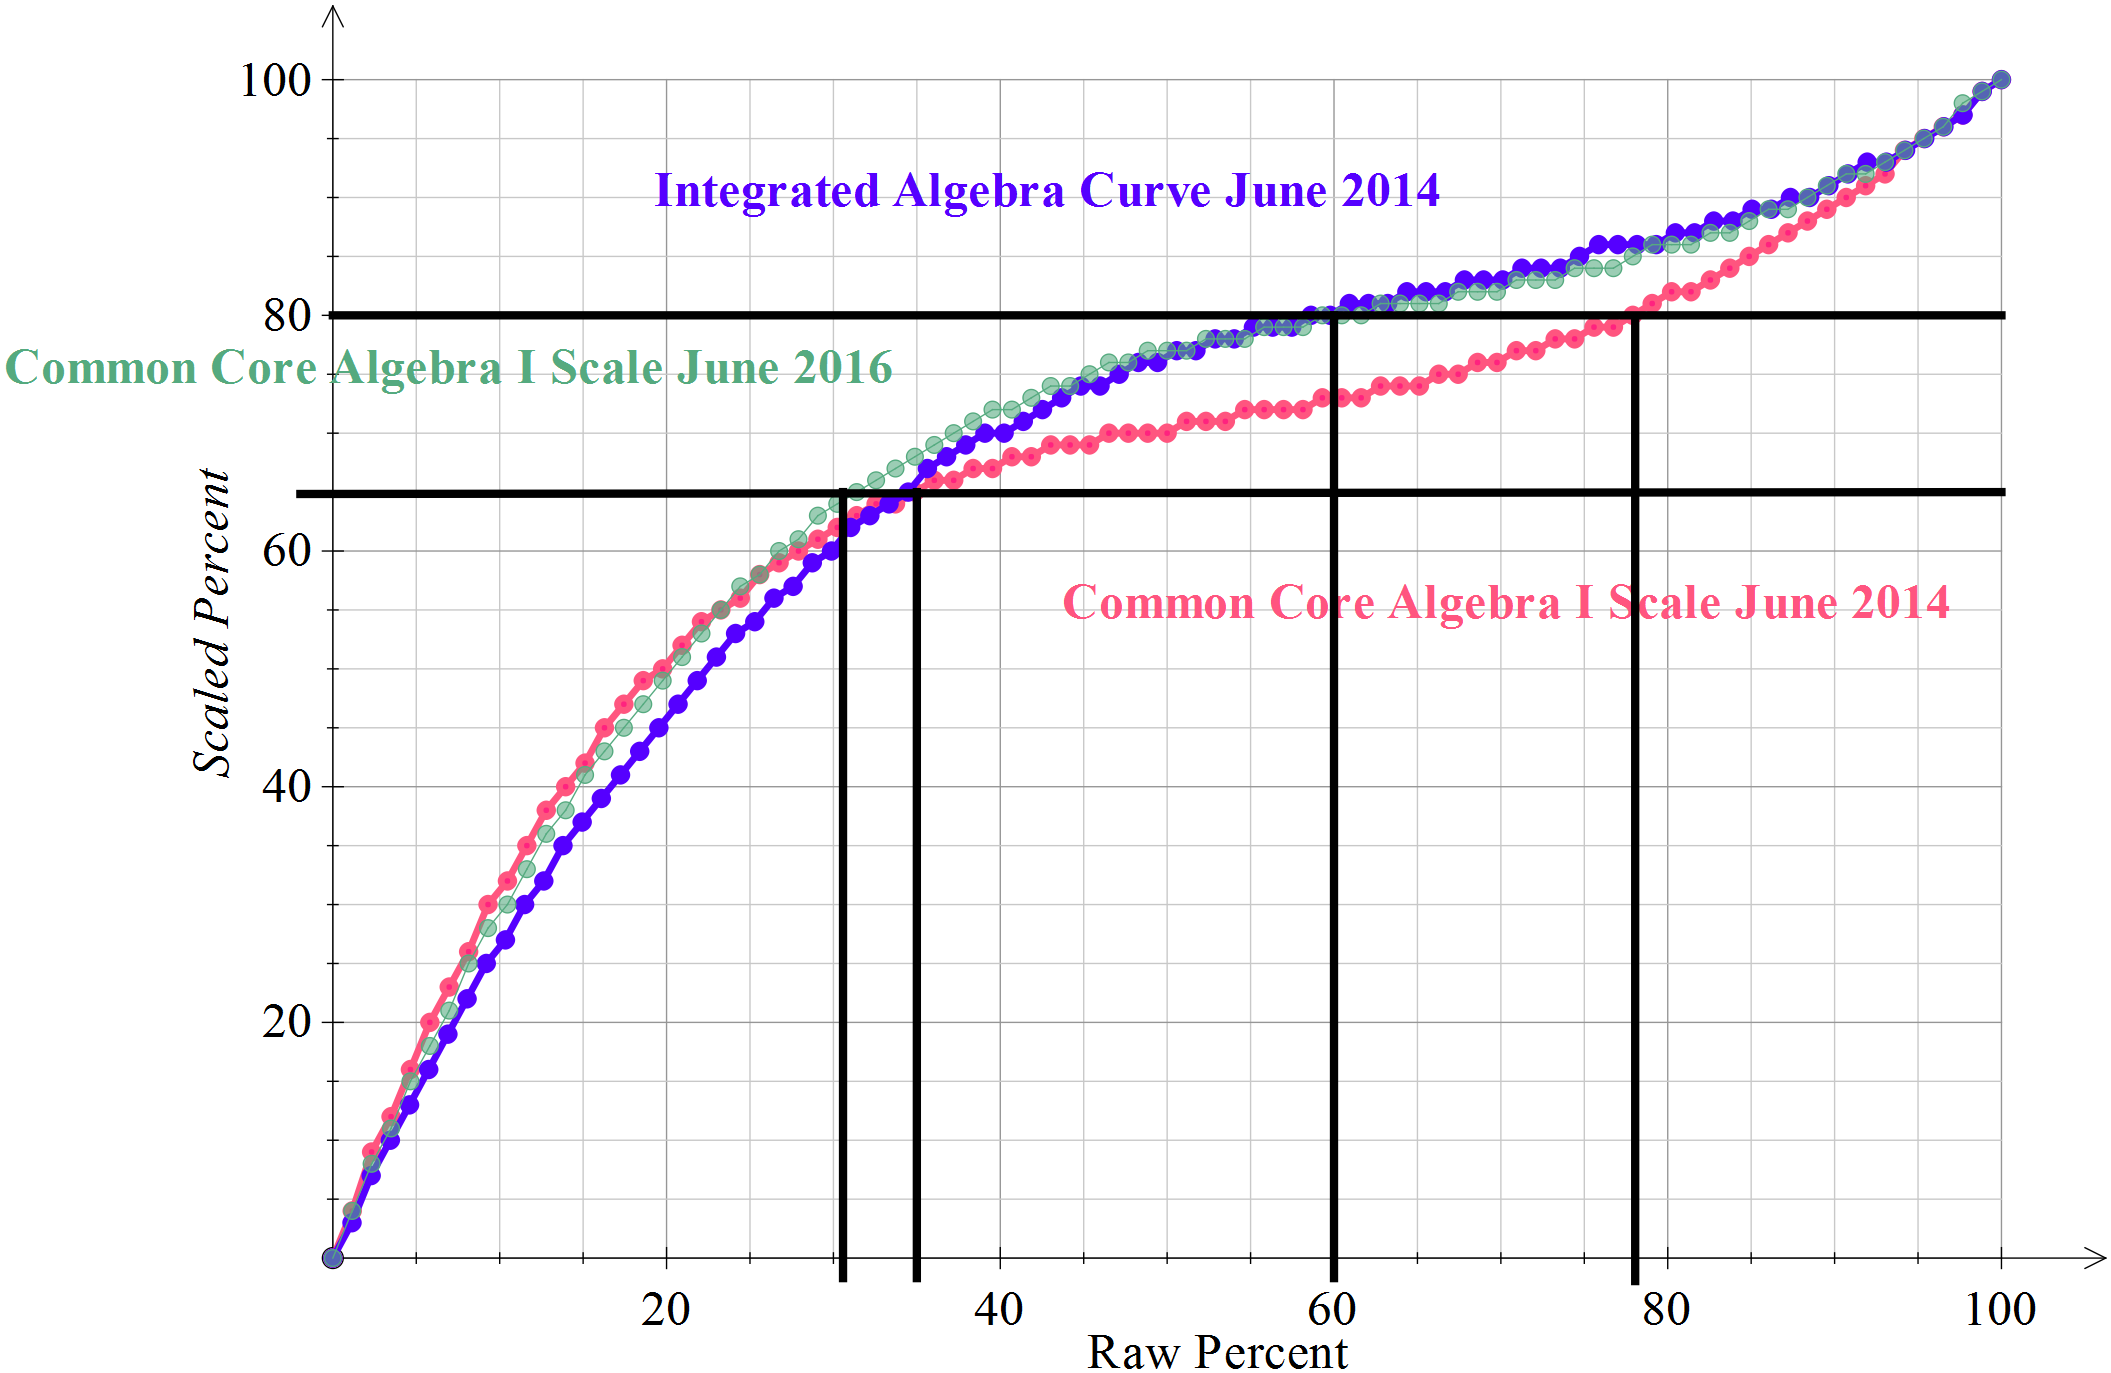
What’s fascinating is that they basically took the two June 2014 curves (red and blue) and spliced them together to create the one for this year (green). Notice how the green curve basically follows the red curve (the June 2014 CC Alg I exam) until the pass mark. Then, it follows the more traditional Integrated Algebra curve the rest of the way.
There are a lot of thoughts I have on all of this once I get past the math itself. My initial thought is how arbitrary it all seems. Right? It used to be that a kid who got an 82 got an 82. But, not anymore. My second thought is that there can now be absolutely no comparison that schools can make to previous year results. You could really only compare raw scores. The scaled scores are meaningless in year over year comparisons. Finally, given that all of this is arbitrary, it certainly seems like this is another case of what I’ve now decided to dub Lake Wobegon Syndrome.
We want our kids to learn more, we want them to be more challenged, but when they don’t live up to those challenges, then we change the metric that we use to make it seem like all kids are above average. But, the plain fact is, with an arbitrary scale such as this one, as a society we can manipulate the results in any way that we want to show any result that we want. So, what is the point exactly? And, how will we really know if our kids are actually learning more math if we can’t even agree on how to measure their progress?
Don’t misconstrue my commentary. I applaud that NYSED listened to voices of parents and teachers around the state and changed the conversion curve. Many students who worked very hard for the last two years felt like complete failures whereas if they had taken math a few years prior, they would have had scores in the 80’s. So, I think this is an excellent start. But, I still think it opens a lot of questions. I will also be extremely curious to see what the curves look like on Common Core Geometry and the brand new Common Core Algebra II.
For now, I need to go watch some soccer! Go U.S.A.
October is here and while the spooky vibes are in full swing, we want to make sure your Math class

This September, eMATHinstruction brings you fresh math tools and updates in time for NCTM 2024, helping math teachers prepare with
Thank you for using eMATHinstruction materials. In order to continue to provide high quality mathematics resources to you and your students we respectfully request that you do not post this or any of our files on any website. Doing so is a violation of copyright. Using these materials implies you agree to our terms and conditions and single user license agreement.
Thank you for using eMATHinstruction materials. In order to continue to provide high quality mathematics resources to you and your students we respectfully request that you do not post this or any of our files on any website. Doing so is a violation of copyright. Using these materials implies you agree to our terms and conditions and single user license agreement.
The content you are trying to access requires a membership. If you already have a plan, please login. If you need to purchase a membership we offer yearly memberships for tutors and teachers and special bulk discounts for schools.
Sorry, the content you are trying to access requires verification that you are a mathematics teacher. Please click the link below to submit your verification request.